Key Takeaways:
- Net revenue retention measures what happens to recurring revenue from the customers you already had.
- New customers stay out of the calculation. Expansion, contraction, and churn stay in.
- Above 100%, your existing customer base grows in revenue. Below 100%, new sales must replace losses before adding growth.
- NRR matters in valuation, but it cannot set a company's price by itself.
- Read NRR alongside gross revenue retention so expansion doesn't hide customer losses.
- Give the team clear account ownership, customer evidence, and a monthly revenue review.
You closed a strong quarter. New contracts came in. The team celebrated. Then you looked at total recurring revenue and wondered why the business barely moved.
Some of your selling replaced revenue you had already won. Customers left. Others bought less. New sales covered the holes before they added anything to the company.
For a founder at $1M to $10M ARR, that difference matters. You can spend another year carrying the sales number while the customer base quietly shrinks underneath you. Net revenue retention, or NRR, makes that problem visible.
The headline makes a strong point, but no single metric literally decides your company's value. NRR tells you whether existing revenue grows or leaks without a new logo. That helps explain the quality of your growth, which matters when someone evaluates your business.
Before you ask your team to sell more, find out how much of today's selling is replacing yesterday's revenue.
1. Calculate NRR using the same customers
Start with a fixed customer group
Choose a completed period, such as the last twelve months. List the customers active at the beginning and their recurring revenue at that point. Keep that group fixed through the calculation, including customers who later leave.
Use annual recurring revenue at both endpoints, or monthly recurring revenue at both endpoints. Don't mix them. Don't compare last year's total invoiced sales with this year's ARR. One is revenue over time; the other is a recurring run rate.
For a cohort with no reactivations, the calculation is:
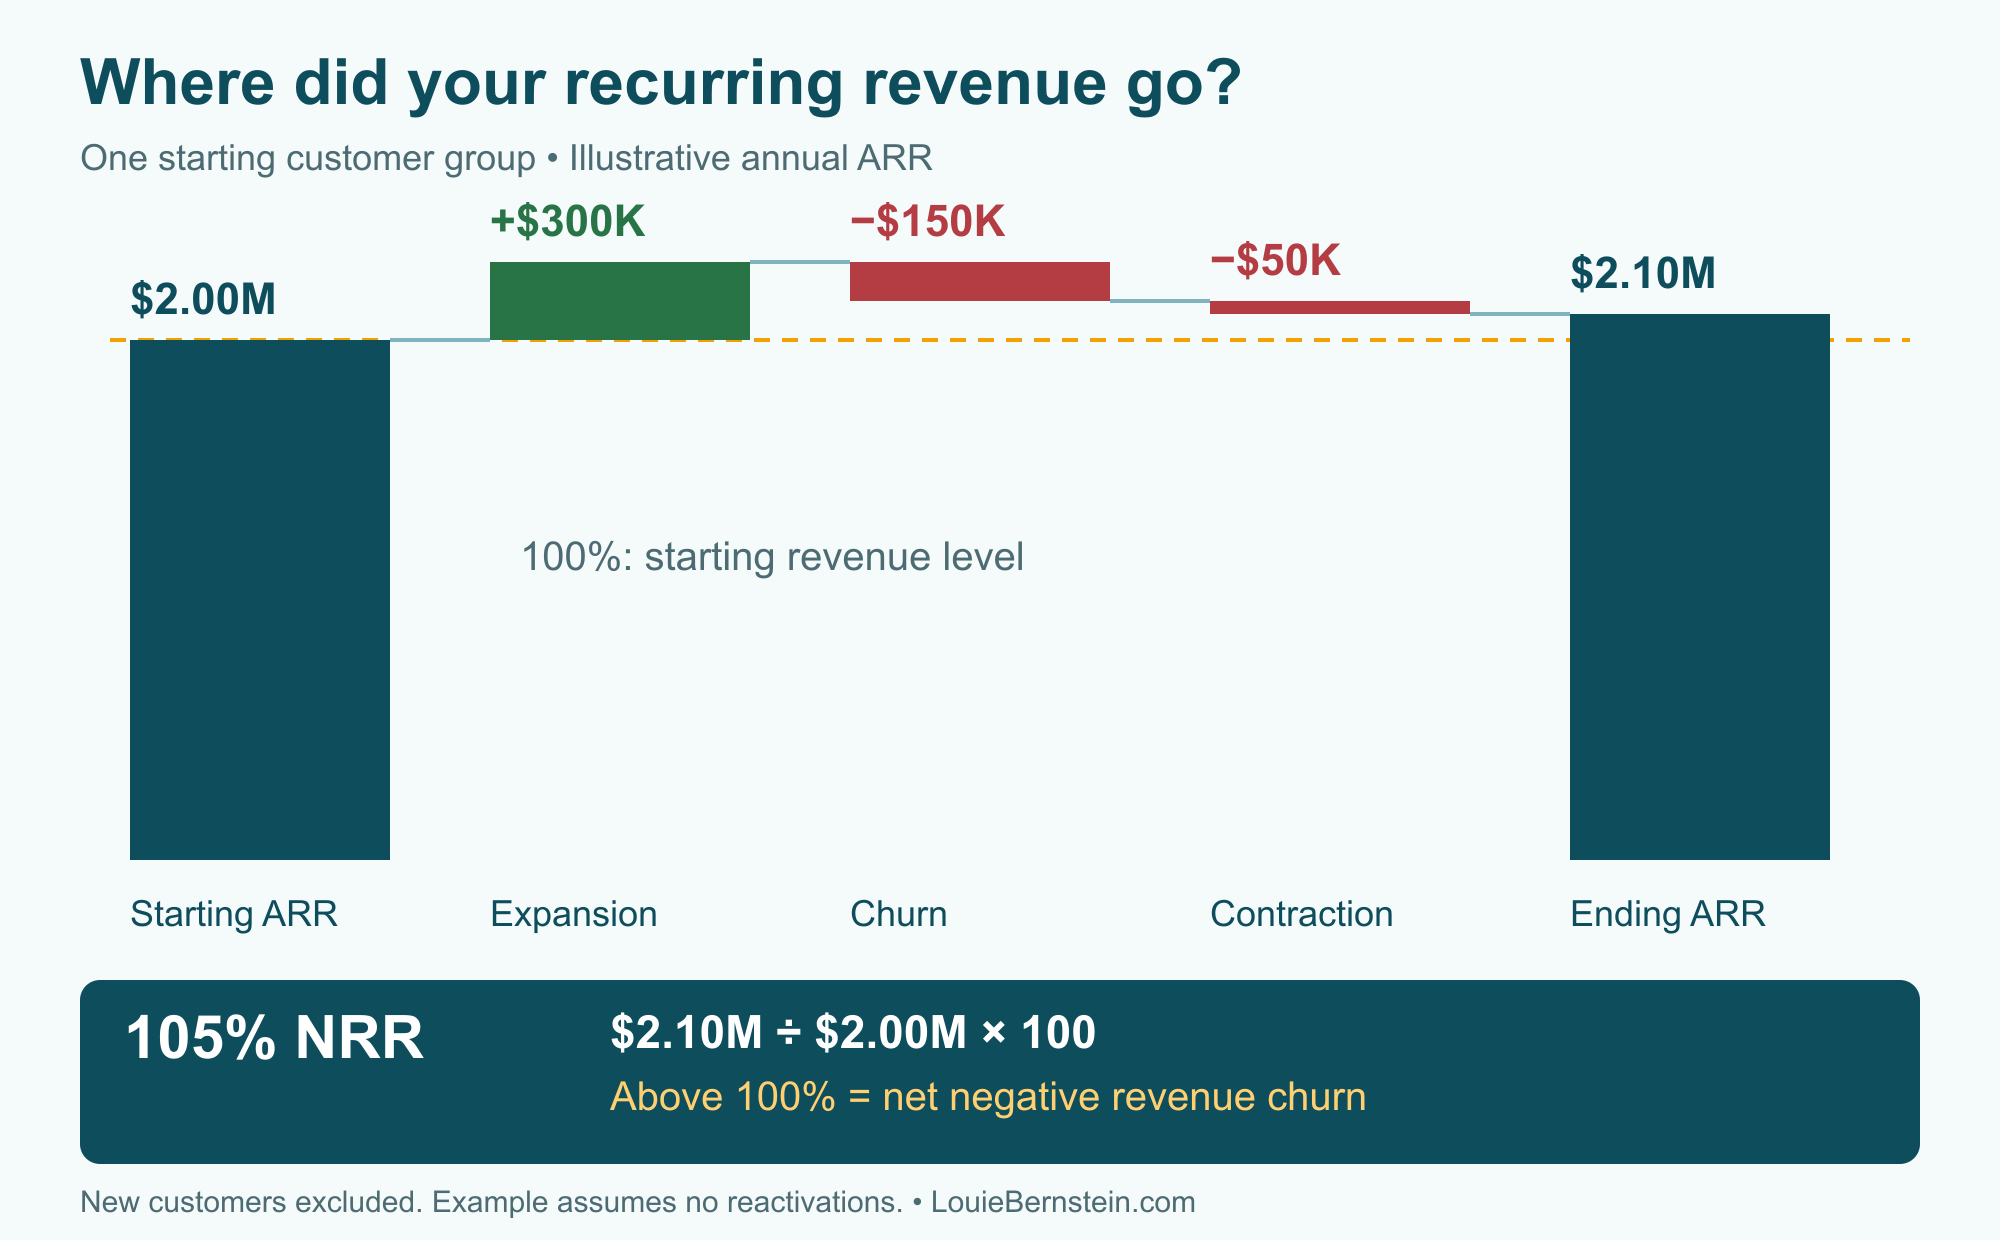
NRR = (Starting recurring revenue + Expansion − Churn − Contraction) ÷ Starting recurring revenue × 100.
Expansion means additional recurring revenue from that starting group. Churn means revenue lost when a customer leaves. Contraction means a customer stays but pays less. New customer revenue is excluded. ChartMogul's calculation notes also explain reactivation handling, which can differ between reports. Document that rule before comparing numbers.
Work through the dollars
Here's an illustrative example, not a client result. Your starting customers represent $2 million in ARR. During the year, those customers add $300,000 through expansion. You lose $150,000 to churn and $50,000 to smaller contracts.
Their ending ARR is $2.1 million. Divide that by the starting $2 million and multiply by 100. Your annual NRR is 105%.
If you also close $500,000 in ARR from new customers, total ending ARR becomes $2.6 million. Your NRR remains 105%. Putting those new customers into the numerator would answer a different question and overstate retention.
Make one person responsible for reconciling this calculation with billing records. The CRM explains the commercial story. Billing confirms the amounts. A dashboard with two conflicting versions of revenue creates arguments instead of decisions.
Keep the starting account list with the report. Use stable account IDs, especially when a customer changes its name or merges billing accounts. Record corrections so next month's review doesn't quietly rewrite last month's starting point.
2. Understand why retained revenue affects company value
Compare the amount of selling required
Imagine two businesses that each start with $3 million in ARR. One has 90% annual NRR. The other has 110%. Assume those rates apply to their starting customer groups for the year.
The first group ends at $2.7 million. The second ends at $3.3 million. That's a $600,000 difference before either business adds a new customer.
To finish the year at $4 million, the first company needs $1.3 million in new customer ARR still active at year-end. The second needs $700,000. These are simplified examples, but the operating question is real: how much new selling must happen just to reach your plan?
If you're still the main closer, that gap lands on your calendar. It affects how much time you can spend coaching, improving the offer, or building the next salesperson's skills.
Treat NRR as evidence, not a price quote
SaaS Capital's 2025 valuation methodology includes NRR alongside ARR growth and public market valuation multiples. That supports paying attention to retention. It does not support claiming that a particular NRR guarantees a particular sale price.
A buyer still needs to understand margins, customer concentration, growth, and risk. A business dependent on one expanding customer deserves a different conversation from one with broad expansion across many accounts.
Ask another question: who keeps those customers growing? If every renewal or expansion requires the founder, the number doesn't prove the team can repeat the result without you. Show the account process behind it.
A stronger retention number is useful. A team that can explain and repeat it is more useful.
3. Read NRR benchmarks without fooling yourself
Use the bands as operating signals
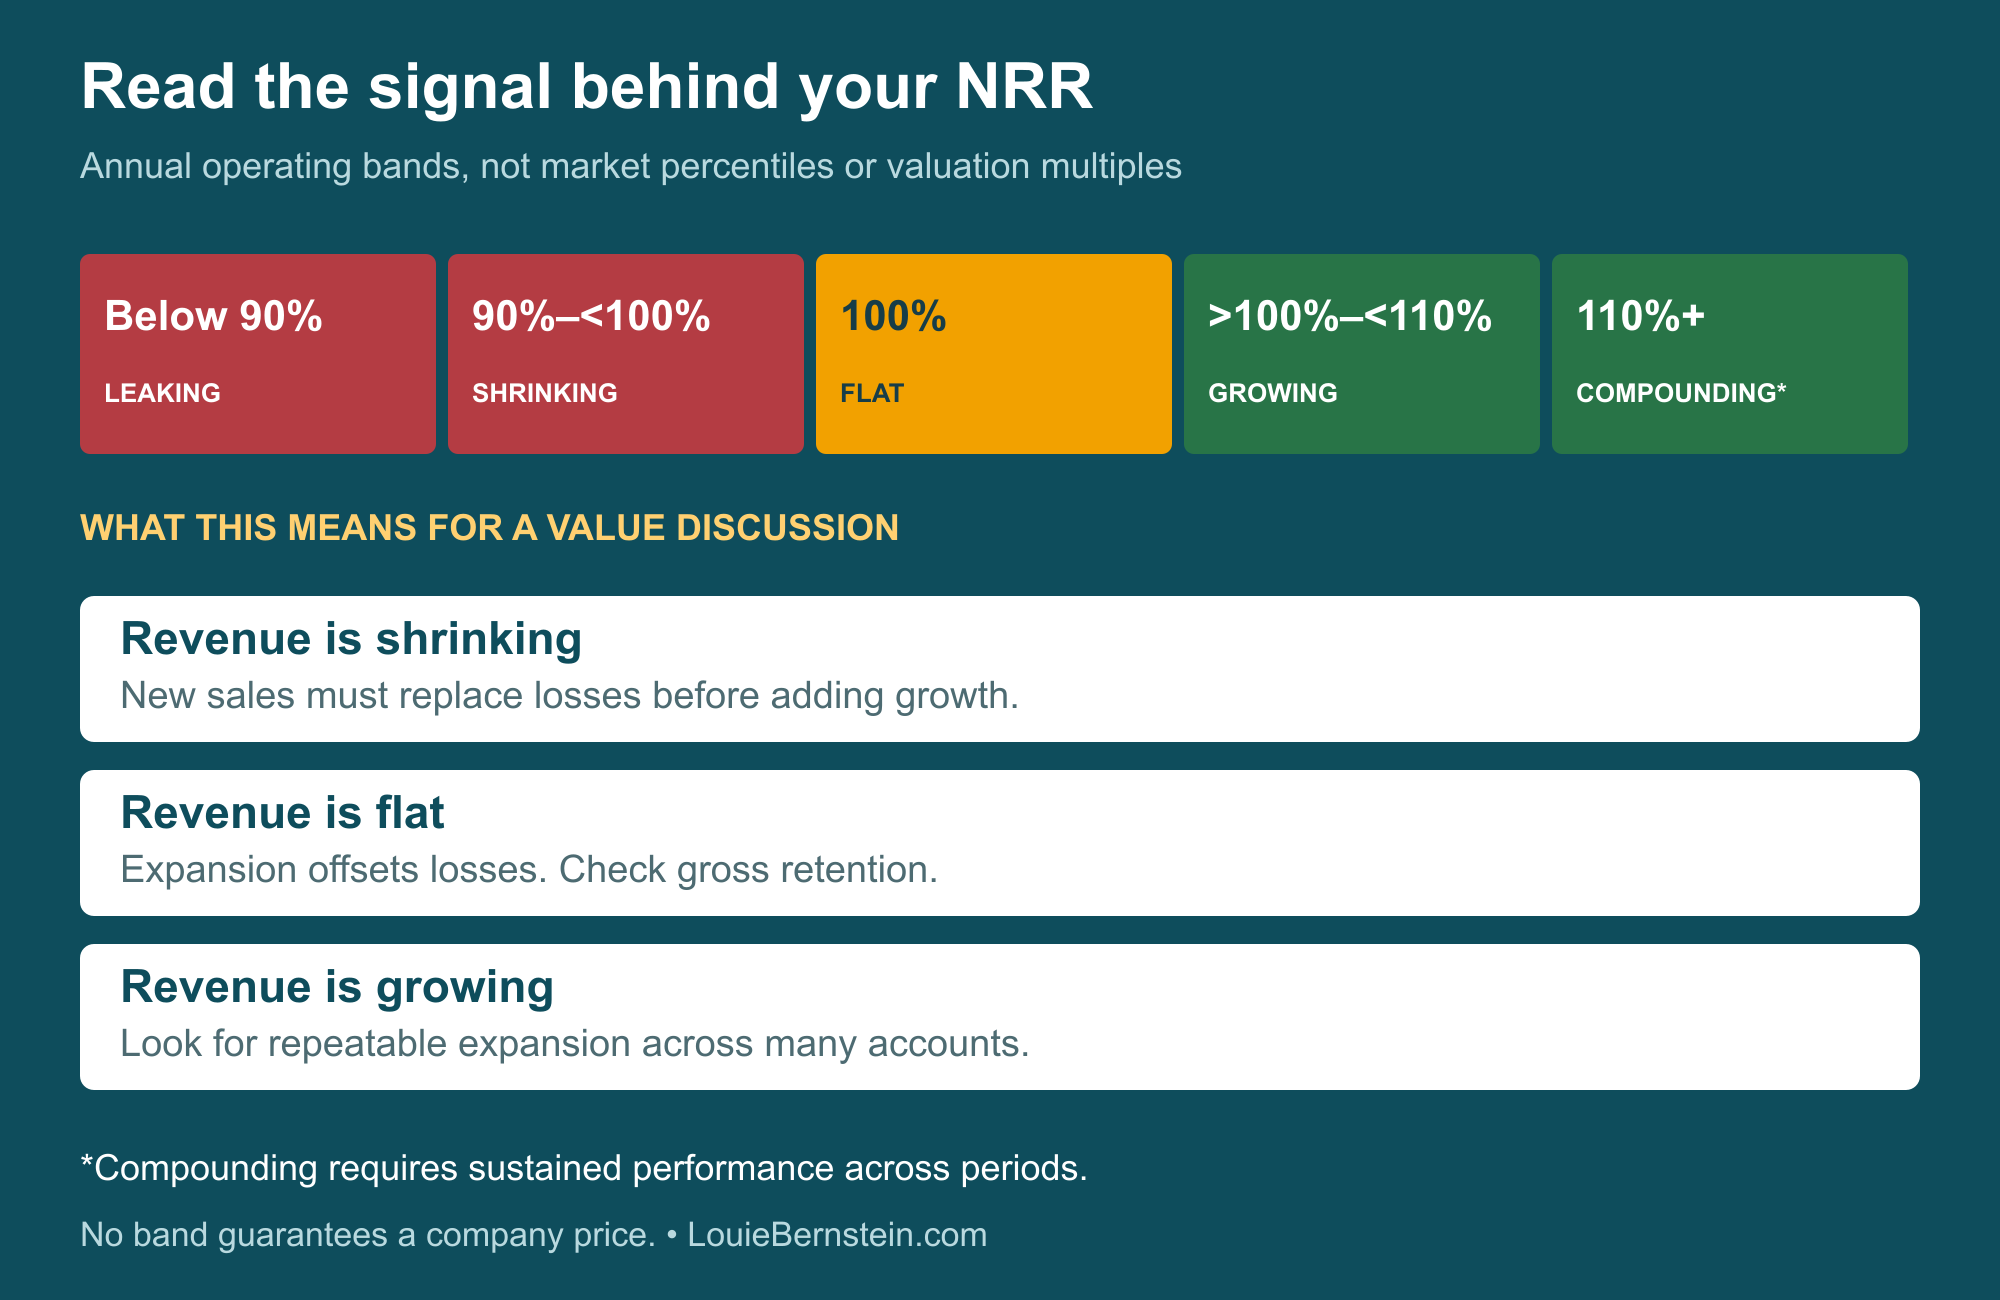
The following bands explain the math. They are not published market percentiles or promised valuation ranges.
Below 90%, the starting customer base has lost more than a tenth of its recurring revenue over the measured period, after expansion. At 90% to below 100%, it is still shrinking. Find the source of the losses before setting a larger sales target.
At 100%, expansion exactly offsets churn and contraction. That is flat revenue from the starting group. It doesn't mean every customer stayed or that delivery is healthy.
Above 100% and below 110%, existing revenue is growing. At 110% or higher, the starting group adds at least a tenth to its recurring revenue. Repeating that performance can compound revenue over time, but a single period doesn't promise the next one.
Compare businesses that resemble yours
A low-priced monthly subscription and a large annual contract have different buying patterns and room to expand. Your stage, customer size, and pricing model belong in the comparison.
ChartMogul's benchmark documentation uses year-over-year retention and allows comparisons by ARR or average revenue per account. Use matching periods and a relevant peer group before calling your number good or bad.
Then look inside your own business. Separate customer segments, acquisition sources, and starting contract sizes where you have enough accounts to learn something. A small sample can swing when one customer changes its contract. Keep the account count and dollars next to the percentage.
4. Check what a strong NRR might hide
Put gross retention beside it
Gross revenue retention, or GRR, removes expansion from the calculation. Using the earlier example, subtract $150,000 in churn and $50,000 in contraction from the starting $2 million. You retain $1.8 million before expansion, giving you 90% GRR alongside 105% NRR.
That combination tells you two things. Existing accounts are expanding, and you are still losing a meaningful amount of the starting revenue. Both deserve attention. Don't let the first result cancel the conversation about the second.
Review customer count as well. A large expansion can offset several smaller customers leaving. The dollars may grow while the number of customer relationships falls. You need to know whether that reflects deliberate focus or a delivery problem spreading through the base.
Separate price increases from deeper adoption
An account can pay more because it adds users, buys another service, or accepts a price increase. Each raises recurring revenue, but each tells a different story about why the customer is spending more.
Label expansion by source. If pricing drove most of the improvement, check the following renewals for contraction and cancellation. If a new department bought in, record the need, decision maker, and results expected.
For usage-based businesses, a strong month can reflect temporary demand. Keep the measurement policy consistent and explain unusual movements. Don't present a seasonal increase as proof that every customer is becoming more committed.
Keep one-time project work out of recurring revenue. If your business mainly sells separate projects, track repeat purchases and customer revenue by cohort instead of forcing every sale into an ARR model.
5. Turn the number into work your team owns
Build a monthly revenue bridge
Once a month, review starting revenue, expansion, churn, contraction, and ending revenue. Show both a monthly view and a trailing twelve-month view. The monthly view finds recent problems. The annual view covers a broader renewal cycle.
Start with the largest movements in dollars. For each one, ask what changed, what evidence supports the explanation, and which action follows. "The customer had budget issues" is a starting point. Find out whether scope, results, sponsorship, or timing also played a role.
Choose a short list of actions with named owners and dates. One account might need a value review. Another needs a corrected onboarding promise. A third has a qualified expansion need. NRR is the score; those actions are the work.
Connect sales promises to account ownership
Capture the customer's expected result during discovery. Pass it to the person responsible for the account after signing. Include what was promised, who agreed to it, and when the customer expects to see progress.
Put renewal and expansion responsibilities in the Accountabilities Document. The owner needs authority, time, and coaching. Assigning a name without changing workload doesn't create coverage.
Use customer actions as stage criteria. "Interested in expansion" is weak. "Buyer confirmed another department's need and agreed to a scope meeting on Tuesday" gives the team something to manage. Keep that evidence in the CRM.
Related Reading: The Renewal You Forgot to Sell
Coach the process before rescuing the account
When a rep raises a risk, ask them to bring the facts, their proposed next step, and the help they need. Role play the customer conversation. Let them lead it when they are ready.
For the next thirty days, aim to establish a trustworthy baseline, assign uncovered accounts, and complete the first review. Don't promise a new annual retention rate in a month. The first improvement is knowing where the revenue goes and who is responsible for the next action.
In the second review, check whether those actions happened and what the customer did afterward. A completed internal task isn't the same as a changed buying decision. Update the Sales Playbook when the team learns something useful, such as a better handoff question or a clearer expansion qualification step.
That's systems before people in practice. Build a process a capable person can run, then coach them to run it. Your job is to make the team stronger, not to become the permanent owner of every account.
Frequently Asked Questions
Q: What is net revenue retention in plain English?
NRR shows how much recurring revenue remains from a starting group of customers after their spending increases, decreases, and cancellations. It excludes new customers. Above 100%, that group's recurring revenue grew during the period.
Q: What does net negative churn mean?
Net negative revenue churn means expansion exceeds revenue lost to churn and contraction, producing NRR above 100% under the same calculation. Customers can still leave. The term describes the net revenue result, not the absence of cancellations.
Q: Is 110% NRR good for a small B2B company?
It means the starting customer group grew recurring revenue by 10% over the measured period. That's useful growth. Judge its quality using a matching peer group, gross retention, customer concentration, and the source of expansion.
Q: Should I calculate NRR monthly or annually?
Track monthly movements to manage the business and use trailing twelve-month retention to see a full annual cycle. Label the period on every report. A monthly percentage and an annual percentage aren't interchangeable benchmarks.
Q: Does high NRR guarantee a higher valuation?
No. It can support a stronger growth story, but a buyer also examines profitability, risk, concentration, market conditions, and how the business operates. There is no universal conversion from an NRR percentage to a company price.
Q: Who should own NRR before we hire a VP of Sales?
Name a leader accountable for the review and give each account a commercial owner. Finance should validate the revenue data. Sales and delivery should act on the causes. The founder can set expectations while coaching the team to handle the account work.
Build revenue your team can keep and grow.
If renewals and expansion keep coming back to you, Fractional Sales Leadership may help you establish ownership, build the Sales Playbook, and coach your team. Learn how I work at LouieBernstein.com.
Schedule a 30-Minute CallAbout the Author
Louie Bernstein
Louie Bernstein is a Fractional Sales Leader who helps B2B founders at $1M to $10M ARR build repeatable sales systems, develop their teams, and reduce founder dependence.