Key Takeaways:
- The famous "3-5x pipeline coverage" rule isn't a magic number. It's just 1 divided by your win rate. A 25% win rate means you need 4x coverage; a 50% win rate means 2x.
- Work backward from the target. Want $1M this quarter at a 25% win rate? You need $4M of qualified pipeline. That one calculation tells you if this quarter is already won or already lost.
- Pipeline velocity has only four levers: number of opportunities, win rate, average deal size, and sales cycle length. Pull any one and revenue moves. It really is just math.
- The lever almost nobody pulls is cycle length. Shortening your sales cycle lifts revenue without adding a single new lead, and it's usually the cheapest lever to move.
- Win rate by stage is the number that makes all of this work. It converts a pile of deals into a real forecast, tells you your true coverage, and shows you exactly which stage is leaking. You don't need a RevOps team to calculate it.
Most founders think pipeline math is something you need a RevOps hire and a Salesforce dashboard to do. It isn't. The core of it fits on a napkin, and once you understand it, you'll never again wonder whether you're going to hit the quarter. You'll know.
There are really only a handful of numbers that matter: coverage, win rate, deal size, and cycle length. Everything else is decoration. In this piece I'll show you how they fit together, how to work backward from your target, and how to find the leak that's quietly draining your quarter.
This is the natural next step after understanding why gut feel stops working around $3M. Once you accept that you need a system, this is the math the system runs on.
The 3-5x Coverage Rule and Why It Exists
You've probably heard you need "3 to 5 times pipeline coverage" to hit your number. It's repeated everywhere, usually with no explanation, which is why most founders treat it as a superstition. Here's the truth: it's not a magic number. It's simple arithmetic.
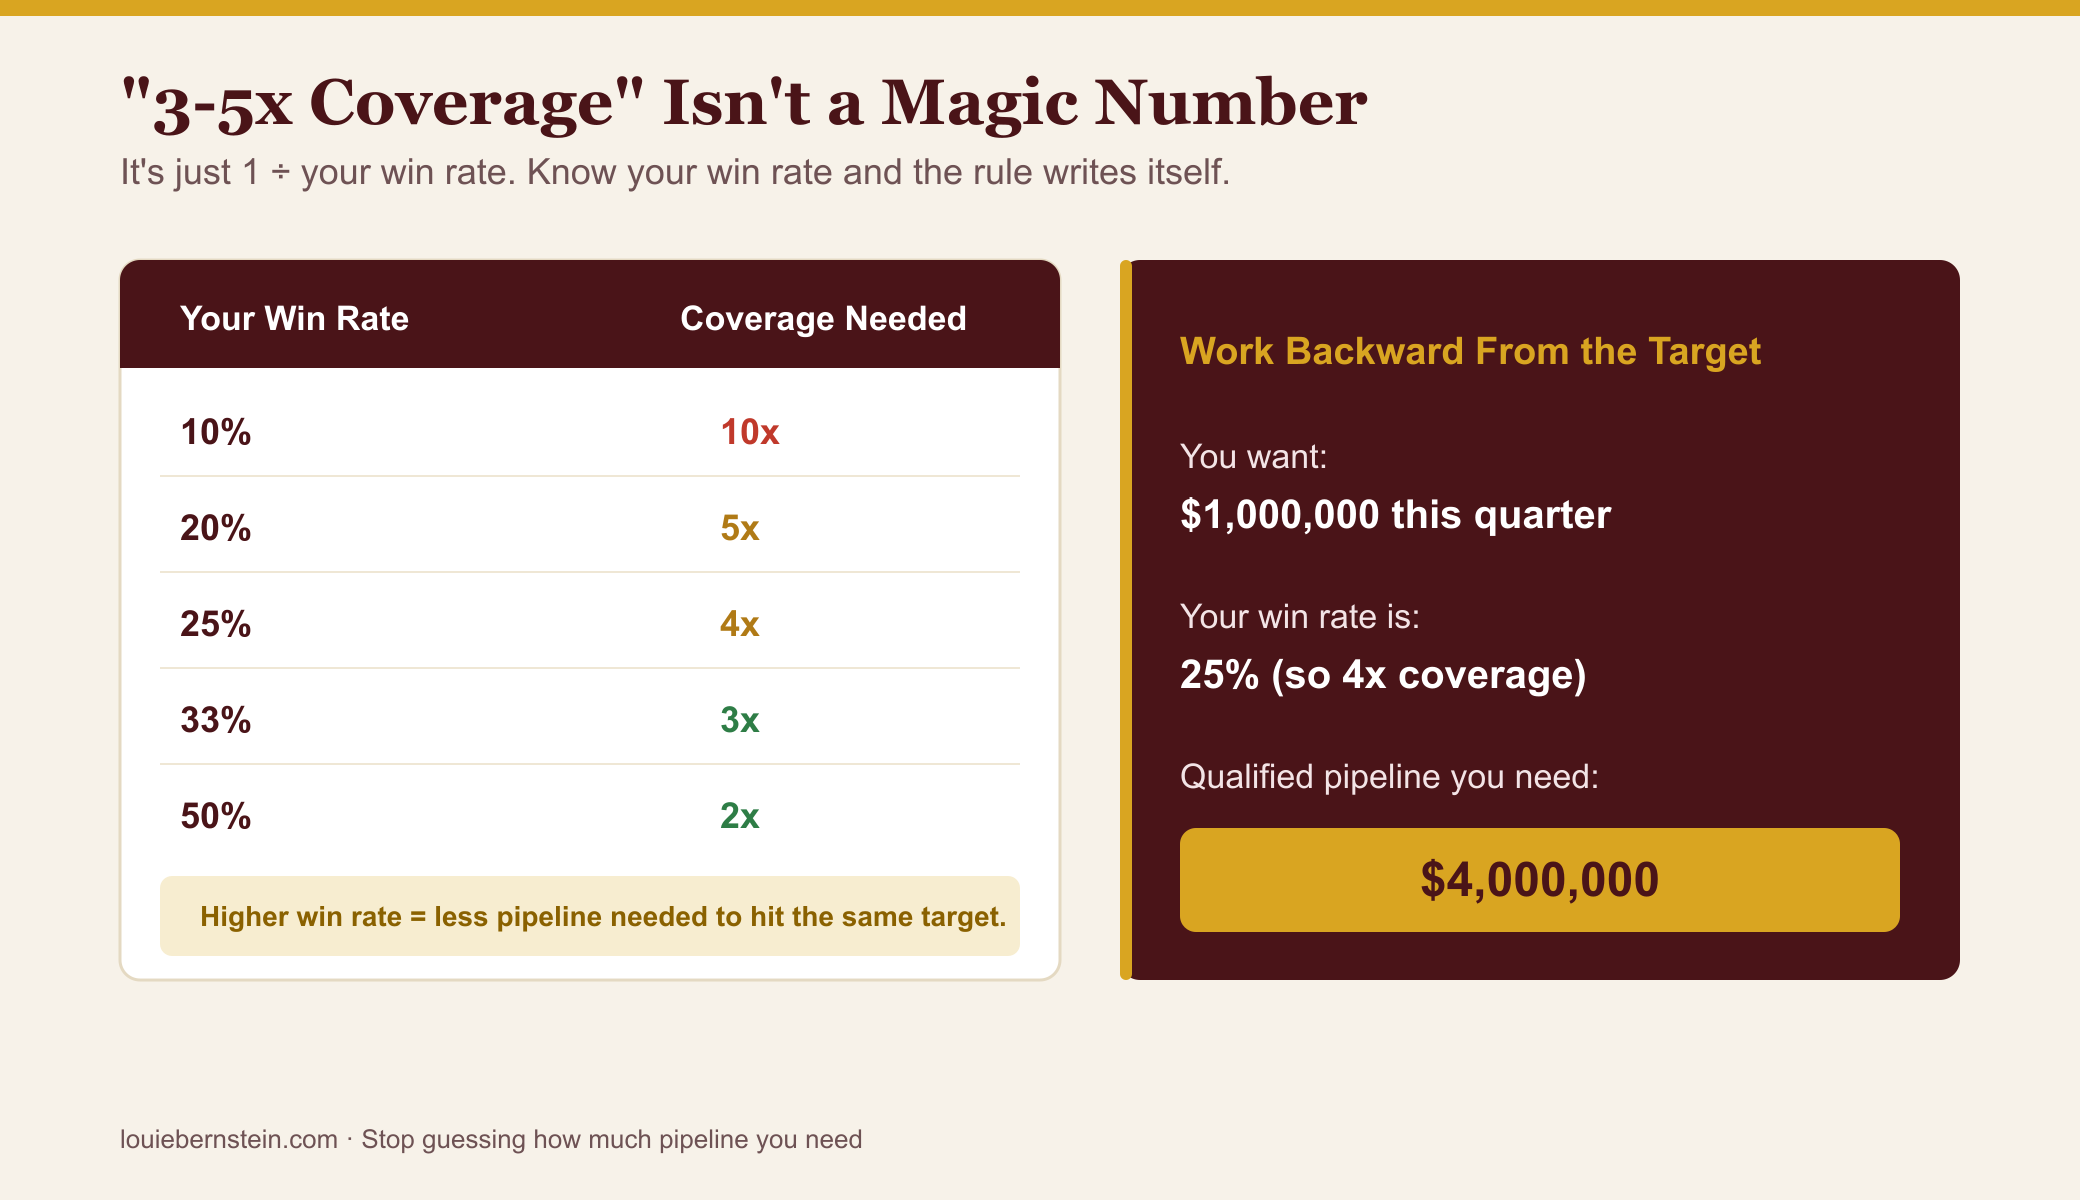
Coverage is just 1 divided by your win rate. If you close 25% of qualified deals, then to close $1M you need $4M in the pipeline, because only a quarter of it will convert. That's your 4x. If your win rate were 50%, you'd need only 2x. The "3 to 5x" range exists because most B2B companies land somewhere between a 20% and 33% win rate. The rule isn't wrong. It's just downstream of a number nobody bothered to tell you: your win rate.
The moment you know your real win rate, you stop guessing at coverage. You calculate it. And a lot of founders discover they've been running on half the pipeline they actually need.
Working Backward From Your Revenue Target
This is the single most useful calculation a founder can do, and it takes about a minute. Start with the number you want, then work backward:
- Target: "I want $1M in new revenue this quarter."
- Win rate: "We close about 25% of qualified deals." So coverage is 4x.
- Pipeline needed: $1M × 4 = $4M of qualified pipeline must already be in flight.
- Deal count: If your average deal is $40K, that's 100 qualified opportunities.
- Reality check: Do you have 100? If you have 40, this quarter is already decided, and no amount of closing energy fixes a coverage gap this late.
That's the power of the math. It moves the fight upstream. Instead of white-knuckling the close in the last two weeks of the quarter, you find out in week one whether you've built enough pipeline to make the target possible at all. If you haven't, you attack lead generation now, while there's still time, instead of discovering the gap when it's too late.
Velocity: The Lever Hiding Inside Your Cycle Time
Coverage tells you if you can hit the target. Velocity tells you how fast your machine turns pipeline into cash. And here's the thing most founders miss: there are only four levers in the entire machine.
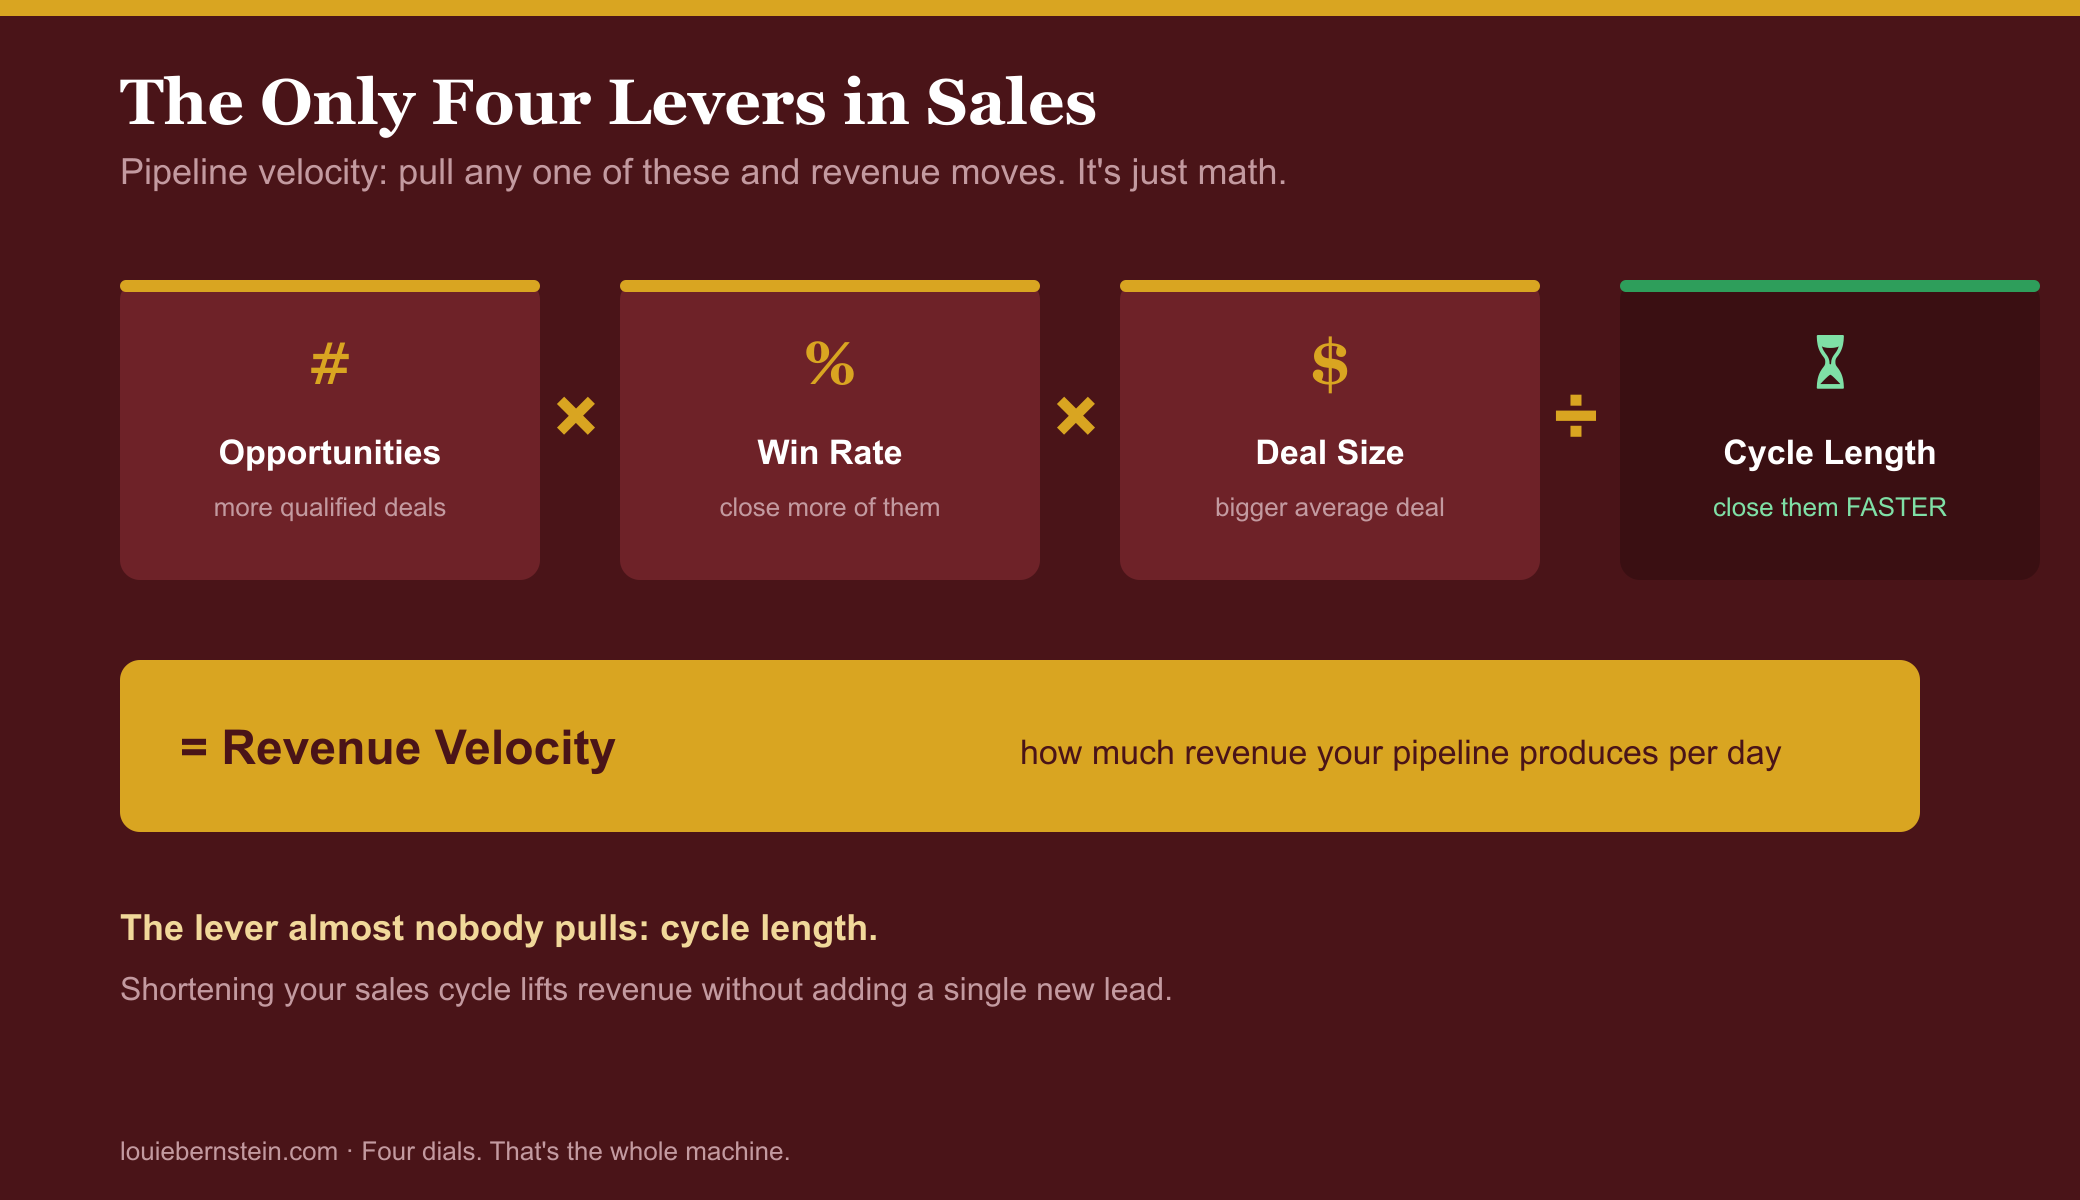
Number of opportunities, win rate, average deal size, all divided by sales cycle length. That's pipeline velocity, and it's the whole machine. Want more revenue? You have exactly four moves: more qualified deals, close a higher percentage, grow the average deal, or shorten the cycle. There is no fifth lever.
Founders pour almost all their energy into the first lever, more leads, because it feels like progress. But the lever hiding in plain sight is the last one: cycle length. Shortening your sales cycle raises revenue velocity without adding a single new lead or hiring a single rep. Cut a 90-day cycle to 70 days and you've meaningfully increased how much revenue the same pipeline produces per quarter. It's often the cheapest, fastest lever you own, and almost nobody pulls it.
More leads is the expensive lever everyone reaches for. A shorter sales cycle is the cheap lever nobody touches. Same result, a fraction of the cost.
Win Rate by Stage, Not by Vibe
Your overall win rate is useful, but win rate by stage is where the real power is. Instead of one blended number, you learn the conversion rate at every step: what percent of Discovery deals reach Qualification, what percent of Qualification deals reach a proposal, what percent of proposals close.
Why does that matter? Because it turns your pipeline into a forecast with math behind it. If 40% of your Validation-stage deals close, then $500K sitting in Validation is worth $200K of forecastable revenue, not $500K of hope. Stage-by-stage win rates only mean something if your stages do, which is why they sit on top of real exit criteria. Guess-based stages give you guess-based math.
Spotting the Leak That's Draining the Quarter
Once you have win rate by stage, diagnosing a slow quarter stops being a mystery. A funnel leaks at a specific stage, and the numbers point right at it. Line up your stage-to-stage conversion rates and look for the one that's far worse than the others.
- Lots of leads, few reach Qualification? You have a lead-quality or discovery problem, not a closing problem.
- Deals stall between Qualification and Proposal? You're likely single-threaded or skipping the economic buyer.
- Proposals go out but don't close? You've got a value or urgency problem, or you're losing to "no decision."
This is the difference between "sales is down, everyone try harder" and "our Qualification-to-Proposal rate dropped from 60% to 35%, so let's fix discovery." One is panic. The other is a diagnosis you can actually act on. Both a stalling pipeline and a leaking funnel show up in these numbers first, which is why I called the stall and the bad forecast the same disease in why 86% of your deals stall.
Running the Numbers Without a RevOps Team
You do not need a RevOps hire or a fancy tool to do any of this. You need a clean record of your deals and about an hour a month. Here's the minimum:
- Log every deal against four stages with clear exit criteria. A spreadsheet works to start.
- Track outcomes. For the last 6-12 months, mark each deal won or lost, and note which stage it reached.
- Calculate win rate by stage from that history. Divide deals that closed by deals that entered each stage.
- Compute your coverage (1 ÷ win rate) and check it against your current pipeline versus your target.
- Review it monthly. Watch the stage conversion rates over time. When one drops, you've found your leak before it costs you the quarter.
That's it. That's professional-grade pipeline math, and it costs you a spreadsheet and an hour. If you'd rather have it built, calibrated, and running properly, with the stages, the CRM discipline, and the review cadence in place, that's exactly what a Fractional Sales Leader does for $1M to $10M ARR companies, without the cost of a full-time VP of Sales. And if you're starting from zero, no deal history, no stages, then step one isn't the math. It's building the record that makes the math possible.
Frequently Asked Questions
Q: How much pipeline coverage do I actually need?
Take 1 and divide it by your win rate. If you close 25% of qualified deals, you need 4x coverage; at 33% you need 3x; at 50% you need only 2x. The common "3 to 5x" rule exists because most B2B win rates fall between 20% and 33%. Don't use a generic multiple, calculate yours from your real win rate. Many founders discover they've been running on far less coverage than their target requires.
Q: What is pipeline velocity and how do I calculate it?
Pipeline velocity is how much revenue your pipeline produces per day. The formula is: number of qualified opportunities, times win rate, times average deal size, divided by average sales cycle length in days. It's useful because it exposes the only four levers you have to grow revenue. Improve any one, more deals, higher win rate, bigger deals, or a shorter cycle, and velocity goes up.
Q: What's the easiest lever to pull to grow revenue?
Usually shortening your sales cycle. Founders default to generating more leads, which is the most expensive lever. But cutting your cycle time, say from 90 days to 70, raises revenue velocity without adding a single lead or rep. You do it by removing friction: clearer next steps, faster follow-up, multi-threading so deals don't stall waiting on one person, and killing zombie deals that clog the funnel.
Q: How do I find where my funnel is leaking?
Calculate your stage-to-stage conversion rates and look for the one that's much worse than the rest. If leads rarely reach Qualification, it's a lead-quality or discovery problem. If deals stall before the proposal, you're likely single-threaded. If proposals don't close, it's a value or urgency issue, often "no decision." The leak is almost always one specific stage, and the numbers point right at it.
Q: Do I need a RevOps person to do pipeline math?
No. You need a clean record of your deals and about an hour a month. Log every deal against four defined stages, track whether it won or lost and how far it got, then calculate win rate by stage from that history. A spreadsheet is enough to start. RevOps tools make it faster and prettier, but the core math is simple enough for any founder to run, and running it beats not running it every time.
Q: I have no deal history yet. Can I still use this?
Not for precise win rates yet, but you can start building toward it today. Define four stages, log every current deal, and record outcomes as they happen. Within a couple of quarters you'll have enough data for real numbers. In the meantime, use conservative industry assumptions (say a 20% win rate, so 5x coverage) as a placeholder. Building that record is the foundation, and it's the first thing a Fractional Sales Leader sets up for a founder starting from scratch.
Not sure if you'll hit the quarter? Let's do the math.
In 30 minutes I'll run your real coverage, win rate, and velocity numbers with you, and show you the one lever that will move your revenue fastest. You'll leave knowing exactly where you stand. See how a Fractional Sales Leader can help at louiebernstein.com.
Schedule a 30-Minute CallAbout the Author
Louie Bernstein
Fractional Sales Leader with 50 years of sales experience helping $1M–$10M ARR companies build scalable, repeatable sales systems. Founder of MindIQ (INC 500). LinkedIn Top Voice in Sales Management, Sales Operations, and Sales Coaching.